
 简体中文
简体中文
Canada and the United States, as the main tourism markets in North America, have mature tourism statistics systems. Understanding their status and statistical methods is crucial to improving my country's tourism statistics.
The design work has important reference significance.
1. Constructing a tourism statistics system based on the demand side
1. Canada
1. Tourism statistics implementation and concept setting
(1) Tourism Statistics Implementation Department
Statistics Canada [1] is the management department and data production department of tourism statistics. It manages three projects for tourism statistics: domestic tourism statistics and
The National Tourism Survey (NTS) for international tourism statistics, the Visitor Tourism Survey (VTS) for international tourism statistics, and the National Tourism Indicators (NTI) for measuring the economic contribution of tourism are shown in Figure 1.
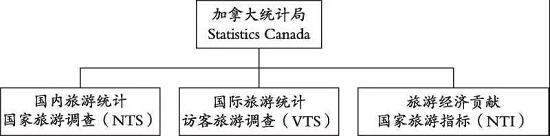
Figure 1 Canadian tourism statistics management structure
(2) Definition of tourist numbers and consumption
Canada adopts the internationally accepted definition of tourism, which is "the activity of people traveling and staying in places outside their usual environment for a continuous period of not more than one year for leisure, business and other purposes not related to obtaining remuneration". The usual environment refers to the place where a person lives, works or studies, and also includes other places that are frequently visited.
Canada uses 80 kilometers one way as the standard for distinguishing the habitual environment. If you cross the international border, it is considered tourism regardless of the distance.
People who travel between the two places regularly for work and study, military personnel, diplomats, flight attendants and border workers are not included.
The definition of Canada is not much different from that of my country. Due to differences in geographical conditions, population density and tourist behavior, the spatial standard of the habitual environment is slightly higher. Canada uses tourism demand to reflect tourism expenditure, that is, the expenditure of tourists on purchasing tourism products. Tourism demand includes the expenditure of day-trip tourists and overnight tourists.
Including domestic and international tourists' expenditure. Tourism demand corresponds to my country's tourism revenue, and the statistical caliber of the two is basically the same. The World Tourism Organization defines "basic statistics" as "statistics directly derived from survey observations or administrative records" and "composite statistics" as "statistics derived from synthetic analysis work".
In addition to basic statistics, Canada uses the Tourism Satellite Account to accurately measure the economic impact of tourism.
The specific indicators include domestic tourism supply, tourism GDP and tourism employment, and the tourism product ratio [2], tourism industry ratio [3] and tourism
2. Tourism Market Statistics (1) Domestic Tourism Statistics NTS collects information on Canadian residents’ travel and expenditure, including the source, destination, length of stay, type of accommodation, purpose of travel and mode of travel. It also provides information on travel
It also measures tourism demand in Canada and internationally, based on visitation rates and demographic characteristics of tourists.
① Survey subjects. The NTS survey subjects are non-institutionalized Native Americans aged 18 and over in the 10 provinces of Canada, excluding those living on Indian reserves and in the three territories [5].
② Sampling method and sample. The questionnaire design is based on the Canadian Residents Travel Survey and the International Travel Survey. It adopts a three-level cross-sectional survey method, based on the province and country.
The three sampling units are determined by household income level, namely, the selected household, the respondents of the selected household, and a certain trip of the respondents. There are about 40,000 selected households per month.
The electronic questionnaire asked the respondents to briefly describe all the trips that ended in the survey month.
If the number of trips exceeds three, all three trips will be retained; if the number of trips exceeds three, the algorithm in the electronic questionnaire will randomly select three trips according to the Poisson distribution sequential sampling principle.
With the help of electronic questionnaires, NTS reduces the time and cost of data input processing and effectively avoids data transcription errors.
The generation of erroneous and invalid questionnaires.
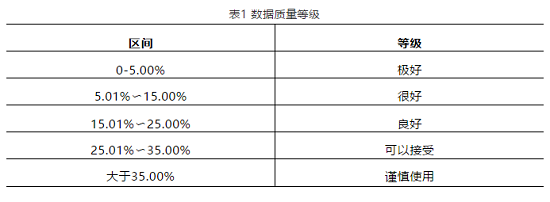
③ Data quality control. Surveys targeting samples rather than populations are prone to sampling variability. Standard deviation, coefficient of variation, and confidence interval are often used as criteria for judging data quality. Canada calculates the coefficient of variation based on the assumption that sample errors follow a normal distribution, divides data quality into five levels, and marks the corresponding levels in the published data, see Table 1.
The response rate of NTS in the first quarter of 2018 reached 32% [6]. In order to avoid non-sampling errors caused by non-response bias [7], a logistic regression model was used to model the probability of respondent response and assign weights to respondents in each probability to reduce potential bias caused by non-response. (2) International tourism statistics Canada uses border statistics and VTS as international tourism statistics tools. Among them, border statistics are provided by the Canada Border Services Agency and are used to count the number of international tourists entering Canada, their entry categories and modes of transportation. VTS provides information on the characteristics of inbound tourists, including travel expenses, travel activities, destinations and length of stay. Relying on electronic questionnaires and exit questionnaires, VTS surveys all U.S. and overseas residents entering Canada, excluding diplomats and their families, refugees, immigrants, military personnel and crew members. 3. Calculation of tourism economic contribution NTI is used to measure the supply of tourism products in Canada, the demand for products by Canadian residents and foreign tourists, and the tourism employment and tourism GDP generated by demand. Its data comes from Statistics Canada's surveys and databases, including NTS, VTS, Canadian Tourism Satellite Accounts (CTSA), supply and use tables, employment surveys and labor productivity databases, as shown in Figure 2. NTI obtains estimates of four indicators through measurement and uses the X12-ARIMA method to seasonally adjust the data.
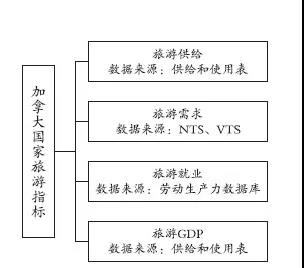 Figure 2 Canadian NTI indicator classification and data source
(II) United States 1. Implementation and concept setting of tourism statistics (1) Implementation department of tourism statistics The National Travel and Tourism Office (NTTO) under the U.S. Department of Commerce [8] is responsible for collecting, analyzing and publishing international tourism statistics. It is the management department of the U.S. tourism statistics system, which consists of seven research projects (see Figure 3): ① International Air Passenger Survey Project, which collects passenger characteristics from more than 30 major countries traveling to and from the United States. ② Visitor Arrivals Project (1-94) data provides official data on monthly and annual overseas visitor arrivals in the United States. ③ The U.S. International Air Travel Statistics Project (1-92) provides international air traffic statistics. ④ Statistics Canada survey project provides data on the flow of tourists between the United States and Canada. ⑤ The International Visitor Forecast Project provides forecasts of international tourists in 20 major tourism markets based on econometric models. ⑥ Tourism and Travel Satellite Account measures the economic impact of tourism. ⑦ International Tourism Revenue and Expenditures Project provides import and export data and trade balance information for the U.S. tourism industry.
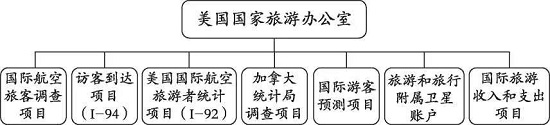
Figure 3 US Tourism Statistics System
Compared with international tourism statistics, the United States has no official agency to manage domestic tourism statistics. Instead, the U.S. Travel Association conducts research on domestic tourism statistics. Each state also cooperates with tourism research companies (such as MMGYGlobal) or universities to complete the practice of domestic tourism statistics.
(2) The definition of the number of tourists and their consumption is similar to the internationally recognized standards. The United States defines tourism as "the travel of various types of 'visitors' (including residents and non-residents) within the United States, and the travel of U.S. residents to foreign countries or places."
Because the definition of internationally recommended standards is broader, in 2014 the U.S. Bureau of Economic Analysis (BEA) added the definition related to education and medical care.
The United States defines tourists as people who leave their country.
Habitual environment [9] [more than 50 miles (80 km) one way from the usual area of activity] for less than one year, or overnight stay in a hotel or motel. Tourists do not include Greek
Travelers who expect to be paid at their destination (such as those working, employed, or traveling between their workplace and their home country, such as diplomats and military personnel).
The spatial scale of the environment is larger, but there is a risk of missing urban leisure tourists when counting them.
Domestic tourism expenditure refers to the expenditure of U.S. residents on domestic tourism, including household tourism expenditure and business tourism expenditure.
Tourism income and tourism expenditure are used to represent inbound and outbound tourism expenditure, which is divided into travel and international transportation. The travel part is used by U.S. residents and international visitors to purchase tourism goods and services.
The expenditure on services includes food, accommodation, leisure, gifts, entertainment, local transportation at the destination, etc. Border trade is also included in the statistics, such as shopping and sightseeing between the United States and Canada, and the United States and Mexico.
A day trip. The international transportation sector includes international transportation fares charged by US companies to international tourists, as well as tickets paid by US residents to foreign companies for round-trip travel between the US and foreign countries
In general, the definition of US tourism income is basically the same as that of my country’s international tourism income, but similar to Canada, the US includes the international transportation provided by the country in its definition.
The statistical scope is wider and the actual operation is more difficult.
Similar to Canada, the United States uses a regular composite index to calculate the contribution of tourism to the national economy, including tourism supply and demand, tourism value added, tourism employment, and tourism
Tour output, etc.
2. Tourism Market Statistics (1) Domestic Tourism Statistics
Due to the lack of information on domestic tourism statistics from the U.S. Travel Association, this article uses the Louisiana tourist visitor study as an example to introduce the domestic tourism statistics work in the United States.
The research commissioned DK Shifflet & Associates, a subsidiary of MMGY Global, to conduct a monthly household sampling survey using electronic questionnaires, surveying approximately 50,000 households across the United States each month.
Households, respondents are adults over 18 years old. Unlike the cross-sectional data in Canada, the survey sample for the Tourism Visitor Study comes from the Knowledge Panel based on address sampling.
【10】 Panel database, and adjust sampling weights based on gender, age, race, education level, source of customers, income, housing type, urban-rural classification, and response rate to ensure sample quality
Representativeness.
The questionnaire included the number of trips in the past three months, destinations, length of stay, type of companions, purpose of travel, travel activities, accommodation and transportation methods, travel expenses, and destination evaluation.
The questionnaire consisted of closed and open questions, and the coding list was updated regularly to ensure accuracy and completeness. The statistical results were obtained from the sample according to the weights.
The estimated quantities calculated (see Figure 4) are reviewed by the DKShifFlet Quality Control Committee, which meets twice a month to review the statistical results and data quality control methods.

Figure 4 Number of tourists to Louisiana in 2017
(2) International tourism statistics
The United States' international tourism statistics are mainly implemented through the Visitor Arrivals Program (I-94), the Survey of International Air Passengers (SIAT) and the International Tourism Revenue and Expenditure Program.
The Visitor Arrivals Program collects and reports the number of non-U.S. residents arriving in the United States from abroad. It is administered by the NTTO in conjunction with the U.S. Department of Homeland Security and Customs and Border Protection and is published on Form 1-94.
The registration information includes arrival time, visa type, mode of transportation, age of the tourist, address in the United States, entry port, etc.
SIAT is designed to collect statistics on airline passengers in the US overseas and Mexican markets (excluding Canada). The project was outsourced by the US government to a survey company
(CIC Research, Inc.) was responsible for implementation, including the selection of survey subjects and survey flights; selection of sampling methods; design of questionnaire content; on-site management; data entry, editing, and verification.
Verification, quality control and weight setting, data backup and data output.
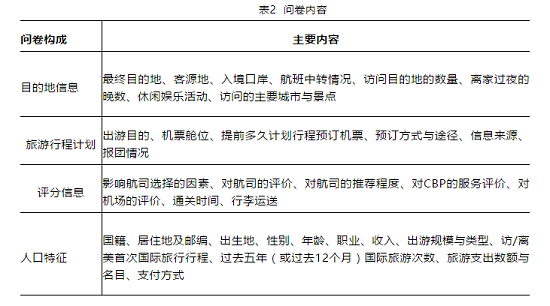
SIAT randomly surveyed non-U.S. residents visiting the United States and U.S. residents departing the United States on selected flights. The content of the questionnaire is shown in Table 2.
2. Reference to Tourism Statistics of America and Canada
First, the compilation of tourism satellite accounts should be regularized. There are three main uses for tourism statistics in the United States and Canada: first, to assess the scale and development status of the tourism industry; second, to analyze the tourism industry
First, we should understand the supply and demand of tourism market by firstly analyzing the components of tourism industry; secondly, we should understand the relationship between the components of tourism industry and compare the development level and competitiveness of tourism industry with other service industries; thirdly, we should use
The United States and Canada both use the internationally recognized satellite account method to account for tourism.
The tourism economy and society have a great impact on the macro-decision-making of tourism development. my country has not established a tourism subsidiary account compilation project. The China Tourism Academy only uses the existing
The demand side and supply side data should be simulated and calculated. An annual special survey and calculation of tourism satellite accounts should be carried out to enrich the calculation content and improve the accuracy of relevant data indicators.
Second, explore ways to improve the time and space standards for the technical definition of tourists and accelerate the revision of the Tourism Statistics Survey System. Some indicators of the Tourism Statistics Survey System revised in 2017
The 2000 standard is still used. China's tourism industry has developed rapidly in the past 20 years. Some indicators no longer meet the current situation of my country's tourism, and the numerical comparability with the same type of indicators in the international community is not good.
For example, the space standard for Chinese tourists is 10 kilometers, while the United States and Canada have a minimum standard of 80 kilometers. The number of domestic tourists in my country cannot be directly compared with that in the United States and Canada.
Re-examine the indicator definitions and standards, and combine traditional statistical methods with big data technology to ensure the accuracy and reliability of tourism statistics.
Third, build a multi-department linkage mechanism for tourism statistics. The establishment of the North American tourism statistics system is not the result of the promotion of a single department, but the result of the joint efforts of multiple government departments.
Tourism statistics work needs to draw on the experience of multi-departmental collaboration, establish a complete process of data collection, processing, production and release, and strengthen data management capabilities.
The power of professional organizations assists in the implementation of tourism surveys and ensures the representativeness and timeliness of tourism statistics.
【1】Official website of Statistics Canada: https://www.statcan.gc.ca/eng/start【2】The tourism product ratio is the ratio of demand for a particular tourism product to its supply. 【3】The tourism industry ratio is the ratio of total tourism demand to total tourism output. 【4】The tourism GDP ratio is the ratio of tourism GDP to the total GDP of the industry. 【5】Three regions of Canada: Nunavut, Northwest Territories, and Yukon. 【6】The weighted average response rate across Canada, with differences between provinces. 【7】Residential residences without valid addresses are also considered non-respondents (about 10%). Since NTS sends questionnaires via email, these residences will still be sampled but will not be included in the NTS. 【8】Official website of the U.S. National Travel and Tourism Office: https://travel.trade.gov/ 【9】Distance standards vary depending on the source of the data survey: the Consumer Expenditure Survey (Bureau of Labor Statistics) uses a standard of 75 miles (120 kilometers) from home; the U.S. Travel Association's survey uses a standard of 50-100 miles (80-160 kilometers) from home; D.K. ShifHet & Association uses a standard of 50 miles (80 kilometers) from home 【10】KnowledgePanel is an online survey platform developed by GfK. It determines the sample through a probability sampling method based on the address. The address is based on the latest delivery order file of the United States Postal Service. The response rate is usually around 65%. 【11】Based on 2010 data. 【12】The questionnaire is available in Arabic, Chinese, French, German, Italian, Japanese, Korean, Polish, Portuguese, Russian and Spanish.


ALL RIGHTS RESERVED:CHINA TOURISM ACADEMY (Data Center ofthe Ministry ofCulture and Tourism)
ICP备案: 京ICP备2021001490号-1


